Busqueda SearchApi | icgc
596 results found

Filters:

Imatge
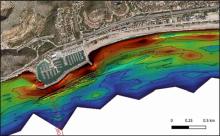
Color map of the seabed around Port Ginesta showing, in red and orange tones, a greater accumulation of sediments to the east of the port due to its barrier effect.

Effect of Port Ginesta on coastal dynamics. A greater accumulation of sediments (reddish colors) is observed to the east of the port.

Imatge
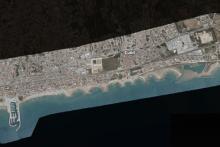
View of the town centre and beach of Cunit with a series of breakwaters perpendicular to the coast, after Storm Nelson, using the Coastal Comparator Viewer.

Cunit - Storm Nelson (March-April 2024). View of the coast after the storm using the Coastal Comparator Viewer.

Imatge
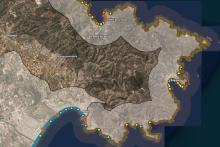
Map of the Coastal Geomorphology Viewer showing the coastline of Cap de Creus, from Port de la Selva to Roses, with colored dots indicating different shapes and processes of the coastal relief.

Visualization of Cap de Creus using the Coastal Geomorphology Viewer.

Imatge
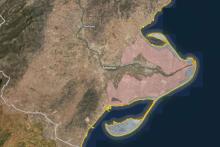
Storm Impact Viewer map showing the Ebro Delta, with the outline highlighted in yellow and red indicating the areas affected by the action of the sea.

Visualization of the Ebro Delta using the Storm Impact Viewer.

Imatge
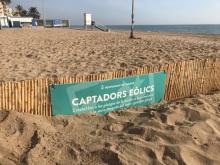
Wooden fence with a sign from Calafell City Council about "wind collectors", installed in the sand of a beach to promote dune formation.

Dune restoration in Calafell.

Imatge
Spectral relationship graph of the measured measurement at the point of photos 17 and 18

Figure 8. Spectral relationship graph of the measured measurement at the point of photos 17 and 18.

Imatge
Example of grade 5 damage in type A constructions. Situation in figure 3

Photos 19 and 20. Example of grade 5 damage in type A constructions. Situation in figure 3.