


Territorial LiDAR
3rd LiDAR coverage of Catalonia
With the completion of the 3rd LiDAR data coverage of Catalonia from an aerial LiDAR and photographic sensor, the ICGC completes the Territorial LiDAR.
From this data, a georeferenced point cloud has been obtained with a minimum density of 8 points/m2 and a simultaneous orthoimage of 15 cm resolution. The capture of the aerial LiDAR data to cover all of Catalonia has been carried out in 2021, 2022 and 2023.
The point cloud describes the morphology of the terrain accurately while the simultaneous orthoimage helps us to interpret it. The point cloud is classified by associating at each point the element it describes, such as the terrain, vegetation or buildings, which allows us to obtain detailed information on these elements and generate elevation models..
| Geoinformation under the Creative Commons Attribution 4.0 International license. More information |
Main technical characteristics
The 3rd LiDAR data coverage of Catalonia is published in sheets of 1 x 1 km, where all sheets have a minimum density of 8 points/m2, and 65% of them have a density greater than 10 points/m2.

Distribution of surveys by sheets
The distribution of the point cloud density coverages of each 1x1 km sheet can be consulted in the metadata.
The 3rd LiDAR data coverage of Catalonia comes from flights made with the LiDAR sensor during the years 2021-2022 and 2023.

Data density distribution
The data density with the flight year of each 1x1 km sheet can be consulted in the metadata.
Work methodology
- What is a point cloud?
It is a set of points positioned in three-dimensional space based on the coordinates (X, Y, H) of a given reference and projection system. Each of these points has different associated characteristics that help us to get to know the territory, one of the main ones is the class, which refers to the element to which the point belongs, be it the ground, a building, the vegetation, etc.
Based on this classification we obtain an accurate three-dimensional model of the different elements of the territory. - How is the flight carried out?
LiDAR data capture for the 3rd coverage of Catalonia has been done from a dual Lidar and photographic sensor on board an aircraft. The aircraft performs the necessary flight missions to capture LiDAR data and aerial images until it covers the entire Catalan territory.
This coverage required 159 missions or flight days. - What is the resulting product and how is it worked and edited?
The data captured by the dual Lidar and photographic sensor are processed in parallel. First the trajectory of the aircraft is processed and the georeference is obtained from the GPS/INS data collected during the flight. Afterwards, the LiDAR data is worked on on the one hand to obtain the cloud of points and on the other hand the aerial images to obtain an orthoimage.
The product obtained is a georeferenced cloud of points that gives a morphological view of the territory, since each point represents an element of the terrain and is the starting point for generating different elevation models.
Point cloud classification
The LiDAR point cloud is distributed in LAS 1.4 format and classified according to the ASPRS standard. Each point is assigned a class that identifies the type of terrain feature it belongs to (ground, vegetation, buildings, water, etc.). This classification is one of the key characteristics of the product, as it enables analytical exploitation. The classification has been obtained using automated algorithms, complemented by targeted manual reviews and edits to correct significant errors.
- Main thematic classes, which describe the predominant elements of the territory: ground, vegetation (by height), buildings.
- Specific subclasses, which allow refining the representation of certain elements, such as terrain key points (model key points), points associated with complex structures (bridges, façades or above buildings), or points over water.
- Quality control classes, which identify anomalous or non‑representative points (low points, air points, or overlaps between flight passes).
- Provisional or unclassified classes, which include points that cannot be reliably assigned to a specific category (Default).
This classification scheme allows selective work with the point cloud and enables the generation of valuable derived products, such as digital terrain models, vegetation cover analysis, or identification of built elements.
In this regard, classification is an essential element for converting the point cloud into a structured database suitable for territorial planning applications, environmental analysis, and volumetric studies.
Below is the list of LiDAR point classes used, including the class code, name, and a brief description of each.
| Class | Class name | Description |
|---|---|---|
| 1 | Default (unclassified) | Points that have not been classified. |
| 2 | Ground (ground) | Ground points not included in the Model key points class (8). |
| 3 | Low vegetation (low vegetation) | Vegetation points with heights above ground between 0.15 and 2 m. |
| 4 | Medium vegetation (medium vegetation) | Vegetation points with heights above ground between 2 and 3 m. |
| 5 | High vegetation (high vegetation) | Vegetation points with heights above ground greater than 3 m. |
| 6 | Building (buildings) | Building roofs with a minimum surface area of 40 m² and a minimum height of 1.8 m. |
| 7 | Low points (low points) | Isolated or small clusters of points located more than 1 m below their neighbours (situated less than 10 m away). |
| 8 | Model key points (key points) | Key ground points needed to generate a digital terrain model. |
| 9 | Water (water) | Points in water bodies longer than 100 m, generally in rivers, reservoirs and coastal waters. |
| 12 | Overlapping (overlap) | Points from overlap zones between flight passes. |
| 17 | Bridge (bridges) | Points located on bridge deck surfaces. |
| 18 | Air points (air points) | Points with heights above ground greater than 200 m. |
| 75 | Other ground (possible ground) | Points with heights above ground between -5 and 0.15 m, potentially ground but not classified as such. |
| 76 | Under building (under buildings) | Points located beneath buildings, usually on façades. |
| 77 | Other building (above buildings) | Points located above building roofs that do not correspond to any of the previous classes. |
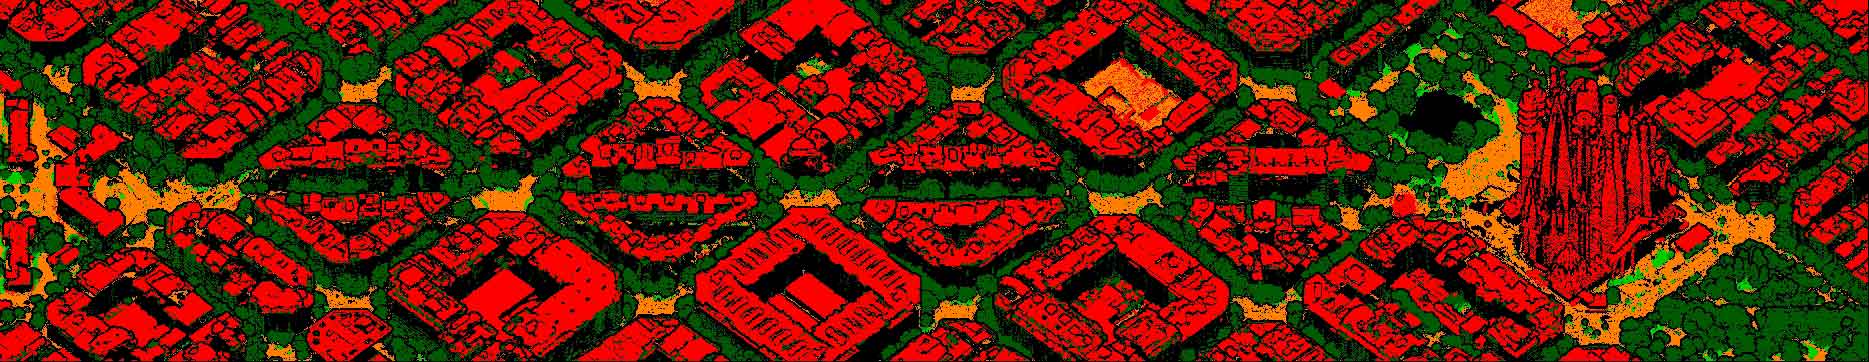
Example of LiDAR point cloud classification

LiDAR point cloud classification
Featured case studies
Morphological study: elevation and surface models
Elevation models are obtained from the classified point cloud, which, depending on the classes chosen, will describe the morphology of certain elements of the territory. Thus, a Digital Surface Model (DSM) can be generated from all the classes that will describe the territory with all its elements. Or a Digital Terrain Model (DTM) can be generated using only the Terrain class that will describe the relief. Combined models can also be generated to describe the elevations of the terrain with vegetation (DTMv) or with buildings (DTMe). These elevation models have multiple uses; an example would be the use of the DTM to create maps of flood zones.

Models (DSM and DTM) and image
Vegetation study
The density of the LiDAR point cloud obtained in the 3rd coverage allows the morphology of the forest mass to be described in detail. From these data, different variables that characterize the vegetation can be calculated, such as the height of the trees or the fraction of covered capacity. The resolution achieved also makes it possible to analyze the scrub and the distribution and structure of the forest, key aspects for forest planning, biodiversity conservation and fire prevention.
As a specific use case, LiDAR data, combined with field work, allow the development of innovative methodologies to generate forest inventories adapted to the reality of the formations of Catalonia. This information makes it possible to obtain structural variables of the tree masses and apply them at different scales, thus contributing to the planning and monitoring of forest management within the current management instruments.

Detailed description of the forest
Volumetric studies
The careful modelling of the terrain morphology obtained from LiDAR data allows us to monitor changes in the territory, especially in changing areas such as waste dumps, quarries and controlled deposits. Volumetric studies of the material supplied or extracted can be carried out from the different covers.

Volumetric calculation