


Figure 2. Tectonic map of the area.

Figure 3. Geological map 1:50,000 (Service Géologique du Maroc, 1984). The black dots represent the positions of the different locations of the main earthquake given by different centers. In blue triangles the locations of the accelerographs. In red circles the areas where observations have been made in the buildings and in orange squares the areas where field observations have been made. The possible path of the fault has been drawn in black dashed line.

Distribution of average PGA values of the horizontal components of accelerograms, in a magnitude-distance representation (Oliveira et al., 2014)
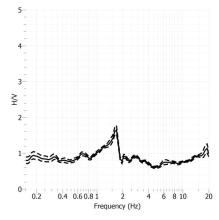
H/V Spectral ratio of seismic noise records from Roquetes seismic station.
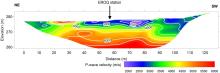
P-wave velocity model of Roquetes seismic station.
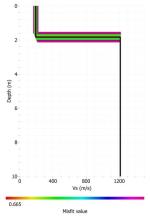
S-wave velocity model of Roquetes seismic station.
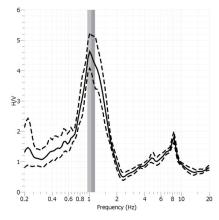
H/V Spectral ratio of seismic noise records from La Seu d'Urgell seismic station.