


Interactive computing application for the analysis of hydrochemical data of Catalonia (HidroGeoR-Shiny)
Interactive web dashboard app for hydrochemical data analysis
HydroGeoR-Shiny v1.0 is a new service offered by the ICGC, based on an interactive web dashboard for hydrochemical data analysis.
This service has been developed within the framework of the ICGC Program IV Contract (2023-2026) [Catalan] and the European GSEU project (A Geological Service for Europe) co-financed by the Horizon Europe GSEU program within work package 4 Assessment, protection and sustainable use of groundwater resources in Europe. The project takes as its starting point the result of the master's thesis (Orriols, 2023), co-directed by the ICGC's Geological Resources Area and carried out within the framework of a scholarship funded by the ICGC, within the Interuniversity Master's in Statistics and Operations Research Universitat Politècnica de Catalunya (UPC)-Universitat de Barcelona, in collaboration with the UPC.
Built using the R statistical programming language and the libraries <shiny>, <shinydashboard> and <leaflet> among others, it provides an intuitive and powerful interface for the visualization, analysis, and interpretation of hydrogeochemical facies, bringing technical information closer to a wide audience, from professionals to managers and researchers.
The integration of an interactive GIS viewer with the official cartographic geoservice of the ICGC, as well as the ability to work with both official and user-provided data, enables detailed and customized analysis of the hydrogeological reality of the territory.
Publication date: July, 2025.
| Geoinformation subject to a Creative Commons Attribution 4.0 International license (CC BY 4.0) More information |
This versatile tool improves hydrogeochemical spatial analysis thanks to several key features:
- Data integration: The tool allows harmonizing and managing large volumes of hydrochemical data, facilitating their compilation and standardization for more rigorous and efficient subsequent analysis.
- Interactive visualization in GIS environment: The integrated GIS viewer enables placing data in their spatial context, reducing uncertainty in interpretation and helping to understand the distribution and relationships between hydrogeochemical facies and territorial settings.
- Advanced and dynamic analysis: The application includes functionalities for univariate, bivariate, and multivariate analysis, automatically updating results based on the selection of data or groups using Gaussian mixture classification models. This allows intuitive and immediate identification of patterns and trends.
- Ease of use and accessibility: The web interface, developed with R libraries such as Shiny and Leaflet among others, makes the tool accessible and easy to use, both for experts and less specialized users, promoting democratization of access to hydrogeochemical information.
- Decision support: By allowing real-time data selection, filtering, and analysis, HydroGeoR-Shiny becomes a support tool for sustainable water resource management, facilitating decision-making based on objective and updated data..
The operation and use of the application

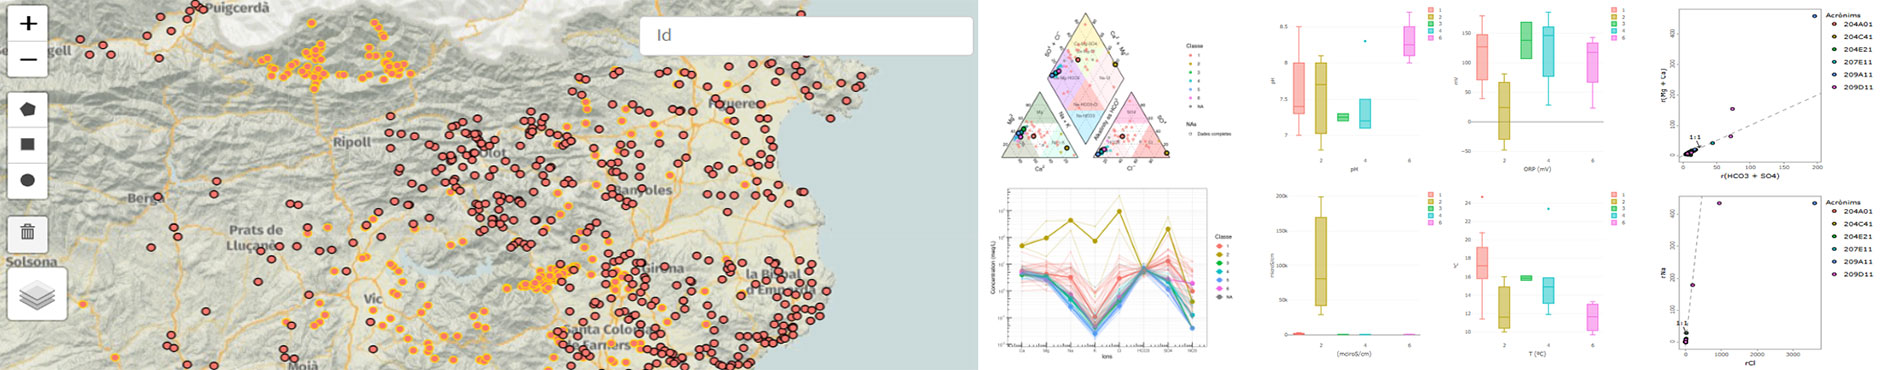
Several images of the exploitation and use of the application. At the top left, main view; to the right, univariate and bivariate analysis of hydrogeochemical data; and at the bottom, different views of data representation.
The application integrates hydrochemical data from the hydrogeological map database of the ICGC (BDSIMHCat) and also allows users to upload their own data. Once inside the application, it is necessary to follow instructions to download and complete a template, which, once filled out and uploaded to the platform, enables analysis of the hydrochemical data provided by the user.
The application treats the data as compositional (CoDa, from Compositional Data) and applies the necessary mathematical transformations for their correct analysis and interpretation.
The interactive map allows selection and filtering of data by attribute or location, cross-referencing them with GIS vector layers. A Piper diagram displays the distribution of facies in the selected samples, while univariate analysis is conducted using interactive violin plots for various solutes. Bivariate analysis includes ionic ratio charts by default. For multivariate analysis, the application uses a Gaussian mixture classification method, which groups samples according to their similarity, offering multiple refinement options for the user.
The classification results are exported directly to the GIS viewer of the application for spatial analysis, with supporting layers such as the delimitation of the 1:50,000 Hydrogeological Units of Catalonia or the reference geological base. Users can generate and export dynamic reports in HTML format using R Markdown, which provide a comprehensive summary of the analysis performed.
Overall, HydroGeoR-Shiny v1.0 represents an improvement in the digitization and exploitation of hydrochemical data, offering a robust platform for their integrated management, visualization, and interpretation, contributing to the improved management of groundwater resources in Catalonia.
For suggestions on improvements or any other matters related to the use and operation of the application, please contact hidrogeologia@icgc.cat.
Application
How the HydroGeoR-Shiny app is referenced
Orriols, E.; Herms, I.; Arnó, G.; Armengol, S.; Colomer, M.; Camps, V.; Fleta, J. (2025). HydroGeoR-Shiny v1.0: Interactive computing application for the analysis of hydrochemical data of Catalonia. Institut Cartogràfic i Geològic de Catalunya, Generalitat de Catalunya. CC-BY 4.0.
Featured references
- Chris, F., & Adrian, E. R. (2006). Some Applications of Model-Based Clustering in Chemistry. R news. https://journal.r-project.org/articles/RN-2006-022/ (accessed on May 2024).
- Egozcue, J. J., Pawlowsky-Glahn, V., & Mateu-Figueras, G. (2003). Isometric Logratio Transformations for Compositional Data Analysis. 35. https://doi.org/10.1023/A:1023818214614.
- Filzmoser, P., Hron, K., & Reimann, C. (2009). Univariate statistical analysis of environmental (compositional) data: Problems and possibilities. Science of the Total Environment. https://doi.org/10.1016/j.scitotenv.2009.08.008.
- Fraley, C., & Raftery, A. E. (2002). Model-based clustering, discriminant analysis, and density estimation. Journal of the American Statistical Association. https://doi.org/10.1198/016214502760047131.
- Fraley, C., & Raftery, A. (2007). Model-based Methods of Classification: Using the mclust Software in Chemometrics. Journal of Statistical Software, 18 (6): 1-13. https://doi.org/10.18637/jss.v018.i06.
- Fraley, C., Raftery, A. E., Murphy, T. B., & Scrucca, L. (2012). MCLUST Version 4 for R: Normal Mixture Modeling for Model-Based Clustering, Classification, and Density Estimation. Washington. https://www.researchgate.net/publication/257428214_MCLUST_Version_4_for_R_Normal_Mixture_Modeling_for_Model-Based_Clustering_Classification_and_Density_Estimation#fullTextFileContent (accessed on May 2024).
- Martin, A. T., & Wing, H. W. (2009). The Calculation of Posterior Distributions by Data Augmentation. Journal of the American Statistical Association. https://doi.org/10.2307/2289457.
- Orriols, E. (2023). Anàlisi, disseny i implementació d’un quadre de comandament (dashboard) interactiu a la web basat en R-Shiny per l’anàlisi i explotació de la Base de Dades del Mapa Hidrogeològic de Catalunya. Projecte Final de Màster, Màster universitari en Estadística i Investigació Operativa (UPC-UB). https://hdl.handle.net/2117/390724.
- Palarea-Albaladejo, A. & Martín-Fernández, J.A. (2014). A bootstrap estimation scheme for chemical compositional data with nondetects. Journal of Chemometrics, 585-599. https://doi.org/10.1002/cem.2621.
- Palarea-Albaladejo, A. & Martín-Fernández, J.A. (2015). zCompositions – R package for multivariate imputation of left-censored data under a compositional approach. Chemometrics and Intelligence Laboratory Systems, 143: 85-96. ScienceDirect. https://doi.org/10.1016/j.chemolab.2015.02.019.
- Piper, A. (1944). A Graphic Procedure in the Geochemical Interpretation of Water-Analyses. Eos. Transactions American Geophysical Union, 25: 914-928. http://dx.doi.org/10.1029/TR025i006p00914.
- Scrucca, L. (2010). Dimension reduction for model-based clustering. Stat Comput, 20: 471-484. https://doi.org/10.1007/s11222-009-9138-7.
- Scrucca, L (2018). Graphical Tools for Model-based Mixture Discriminant Analysis. https://doi.org/10.48550/arXiv.1508.01695.
- Stiff, H. A. (1951). The interpretation of chemical water analysis by means of patterns. Journal of Petroleum Technology, 3 (10): 15-17. https://doi.org/10.2118/951376-G.