


Coastal hazard
Geological hazard due to landslides and coastal landslides
The Coastal hazard viewer shows the geological hazard due to identified landslides and landslides along the entire coast of Catalonia, on beaches (coves and other bathing areas), and on coastal paths. The study area is shown by means of a semi-transparent polygon at relatively small scales (greater than 1:50,000) and with a dashed line at larger scales.
The viewer is part of the Coastal Dynamics Information Service (SIDL) project, promoted by the Department of Climate Action, Food and Rural Agenda and financed by the Climate Fund, with the supervision of the Interdepartmental Climate Change Commission and with the technical assistance of the Climate Fund Commission.
The objective of the viewer is to provide a tool to support territorial, urban, road and infrastructure planning in general. This should allow administrations, companies and individuals to have an overview of the coastline with respect to geological hazards.
Viewer
Description
The methodology of the Map for the Prevention of Geological Risks (MPRG25M) is used at a scale of 1:25,000.
Its methodology is based on the following three main phases:
- Inventory cartography: Collection and analysis of historical documentation, Interpretation of aerial photographs (old and recent flights) and orthophotos, Field reconnaissance and population surveys and Preparation of an inventory of geological phenomena (landslides, subsidence, etc.) and signs of activity.
- Determination of susceptibility: Delimitation of susceptible areas: zones of departure, route and arrival of the phenomena, Identification of lithologies and morphologies favorable to the generation of risks and Use of numerical modeling to estimate the scope and affected areas.
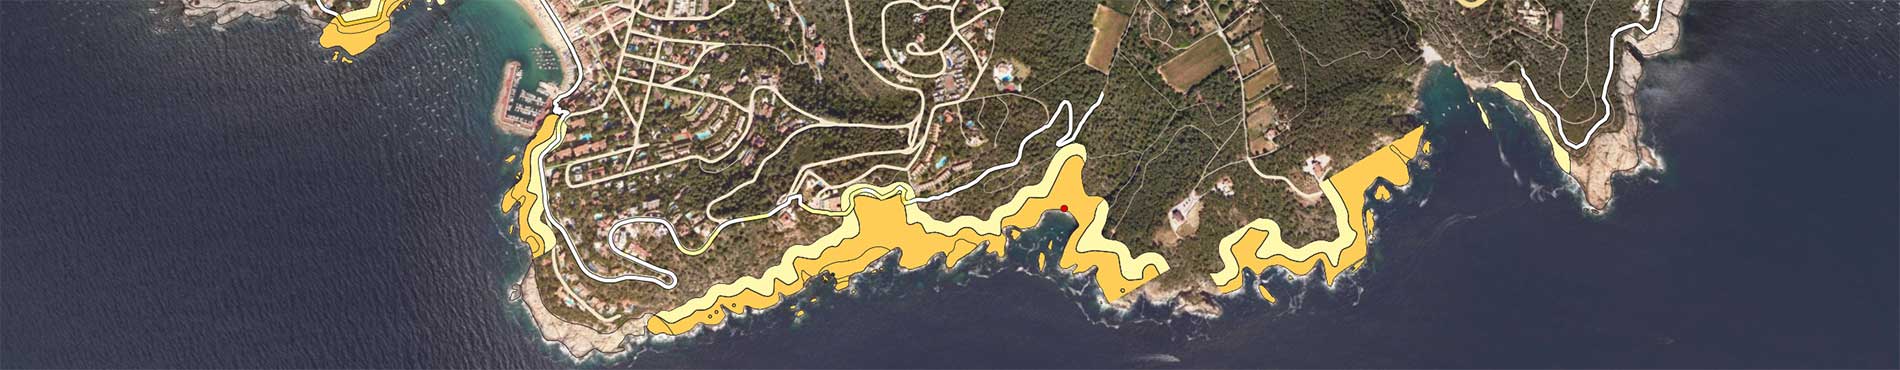
- Determination of hazard: Classification of areas according to the intensity (dimensions and energy) and frequency of the phenomena. The hazard is represented in three degrees: High (red), Medium (orange) and Low (yellow). The studied areas where no hazard has been identified are left without color. This multi-hazard map allows an integrated view of the different geological hazards (external such as landslides, torrents, floods, and internal such as earthquakes) and is essential to avoid construction in risk areas.
The information is structured in the following 4 sets of information:
- Inventory of phenomena and activity indicators: This set includes the inventory of slope movements and their indicators, as well as the geomorphological features that can generate hazard associated with the different phenomena analyzed. The user can visually identify each element using the available legend or by clicking directly on the element on the map.
- Geological hazard due to slope movements on the coast: The geological hazard has been analyzed in the 911 linear km (length measured at a scale of 1:5,000) of the Catalan coast. This set includes, in individual layers, the hazard for each of the phenomena analyzed, and, in a single layer, the multi-hazard layer, which graphically shows the superposition of hazards due to the coincidence of more than one phenomenon in the same place. In no case are hazards added, only the existence of an overlap is indicated. The established symbology allows us to identify that such an overlap of phenomena exists and what the maximum overlapped hazard is. The user can visually identify the degree of hazard using a traffic light code that shows the available legend or by clicking directly on the polygon on the map.
- Geological hazard due to slope movements on beaches: A Based on the analysis of the geological hazard on the coast, the degree of hazard has been identified for the 597 beaches managed by the General Directorate of Coastal Policies. Initially, the user can check if a hazard has been detected on a given beach. By clicking on the point representing the beach, the viewer shows general information about the beach, as well as the detail of the hazard associated with landslides and/or landslides.
- Geological hazard due to slope movements on the coastal paths: Based on the analysis of the geological hazard, the degree of hazard has been identified in the 810 linear km of coastal paths. The user can visually identify each section based on its hazard or by clicking directly on the section on the map.