


Impact of storms
Geomorphological cartographies of the surfaces flooded by maritime storms that have impacted the Catalan coast in recent years
The Storm Impact viewer shows the geomorphological maps of the surfaces flooded by maritime storms that have impacted the Catalan coast in recent years. These maps are mainly based on the photointerpretation of high-resolution aerial images captured by the ICGC after the storms.
Specifically, the maps of the three storms with the highest impact, both in terms of their extent and consequences, that have occurred since 2017 are shown:
- January 2017.
- January 2020 (Gloria).
- March-April 2024 (Nelson).
This viewer is part of the Coastal Dynamics Information Service (SIDL) project, promoted by the Department of Climate Action, Food and Rural Agenda and funded by the Climate Fund, with the supervision of the Interdepartmental Climate Change Commission and with the technical assistance of the Climate Fund Commission.
The interactive interface of the viewer has several tools that allow: simultaneous viewing of pre- and post-storm maps and images; taking screenshots; and editing tools, among others. In addition, the viewer includes navigation and zoom tools that allow detailed exploration of areas of interest.
The objective of the viewer is to show the impact of recent storms and the distribution of their effects along the Catalan coast. It also offers a regional-scale view of the danger posed by highly energetic storms on the Catalan coast.
Description
The methodology used to create cartographies of the effects triggered by significant maritime storms is mainly based on: the collection and analysis of images published in the press and social networks, recorded during the course of the storm and the days following; and the photointerpretation of aerial images, taken by the ICGC days after each storm, comparing them with previous orthoimages of the coast. With this methodology, continuous and homogeneous cartographies are obtained that show the distribution of the effects and damage caused by storms along the entire coastline, at a scale of 1:5,000. In addition, it allows us to know and analyze the response of the coast to the impact of highly energetic episodes, a previous step to be able to validate the current hazard maps in this strip of territory.
The information contained in the viewer is structured into five blocks of information:
- Coastal storm January 2017. Information related to the effects triggered by the maritime storm of January 19, 2017.
- Coastal storm January 2020 (Gloria). Information related to the effects triggered by the maritime storm of January 19, 2020, generated by storm Gloria.
- Coastal storm March 2024 (Nelson). Information related to the effects triggered by the maritime storm of March 26, 2024, generated by storm Nelson.
- Coastlines: Coastlines obtained from orthoimages of photogrammetric flights carried out by the ICGC, in the days following the impact of each of the storms (More information).
- Maximum flood area: Maximum flood area caused by significant maritime storms that have impacted the Catalan coastal strip in recent years.
To improve the consultation and visualization of all sets of information, the viewer allows you to choose the images or reference maps with which you want to visualize the data. In this sense, it allows you to reference the coastal orthophotos corresponding to the mapped storms and the previous orthophoto of each of them. In the specific case of storm Gloria, the coastal orthophoto of the episode and the orthoimages of the floods of the lower reaches of the Ter, Fluvià and Tordera rivers are displayed simultaneously. In addition to these orthophotos, there is also the option of using two base maps as a reference: the simplified base map and the hybrid ortho base map.
Coastal storm January 2017
Between 19 and 23 January 2017, an exceptional maritime storm occurred, with easterly and westerly winds, which affected the entire Catalan coastline. Immediately afterwards, on 24 January 2017, the ICGC carried out a photogrammetric flight to obtain high-resolution aerial images of the entire coast, with a pixel size of 25 cm.
This set of information shows the geomorphological cartography obtained from the photointerpretation of these aerial images and complemented with other sources of information (press, social networks, fieldwork, etc.). The data is presented through four layers of information:
- Field photographs. Photographs of the impact of the storm on the territory taken during the field campaign carried out on 26 January and 2 February 2017.
- Infrastructure damage. Record of damage identified in the photointerpretation phase and complemented with data obtained from documentary information and/or the field campaign.
- Geomorphological effects. Geomorphological cartography of the most relevant effects triggered by the storm carried out through the photointerpretation of aerial images and comparing them with images prior to the episode.
- Flooded surface. Cartography of the flooded surface identified in the photointerpretation phase and, whenever possible, complemented with data from documentary information or the field campaign.
For more information on the balance of the storm of rain, snow, wind and waves, consult the Press Release.
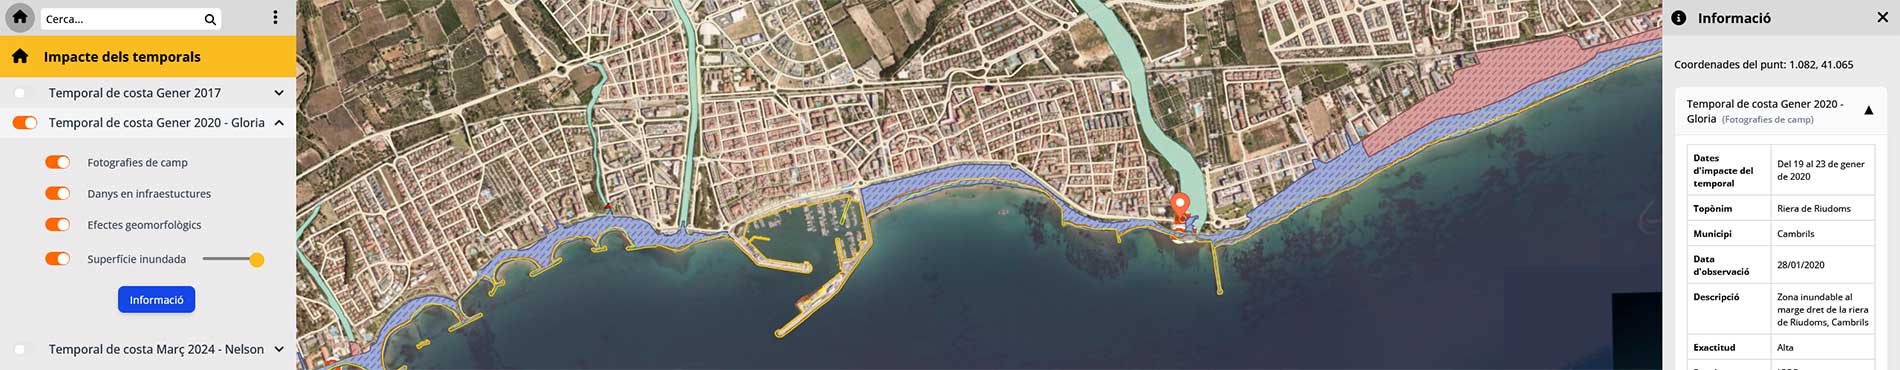
Coastal storm January 2020 (Gloria)
Between January 19 and 23, 2020, storm Gloria hit Catalonia. A storm classified as exceptional, not only due to the multiplicity of phenomena (wind, rain, snow and waves) that occurred, but also due to its extent, affecting the entire Catalan territory. The storm triggered a series of geomorphological effects associated with slope movements and fluvial and coastal dynamics. Regarding the coast, between January 21 and 22, 2020, a historic maritime storm occurred, with easterly winds, which affected the entire Catalan coast. On the one hand, in sections of the Central Coast and the Costa Daurada it was the most important maritime storm in recent decades. On the other hand, on the Costa Brava, the relatively most recent precedent corresponds to the storm of December 26, 2008. In the days following the storm, specifically on January 24, 26 and 27, 2020, the ICGC carried out a photogrammetric flight to obtain high-resolution aerial images of the coastline, with a pixel size varying between 10 and 15cm and a coverage of 90% of the coast.
This set of information shows the geomorphological cartography made through the photointerpretation of aerial images and complemented with other sources of information (press, social networks, fieldwork, etc.). The data is structured into four layers of information:
- Field photographs. Photographs of the impact of the storm on the territory taken during the field days carried out between January 28 and February 7, 2020.
- Infrastructure damage. Record of damage identified in the photointerpretation phase and complemented with data obtained from documentary information and/or the field campaign.
- Geomorphological effects. Geomorphological cartography of the most relevant effects triggered by the storm carried out through the photointerpretation of aerial images and comparing them with images prior to the episode.
- Flooded surface. Cartography of the flooded surface identified in the photointerpretation phase and, whenever possible, complemented with data from documentary information or the field campaign.
For more information on geomorphological effects, see The Gloria Storm (19-23/01/2020): the effects of geological processes on the territory (Technical Monograph, 8) (Catalan).
For more information on the balance of a historic earthquake in Catalonia, see the Press Release.
Coastal storm of March 2024 (Nelson)
Between March 26 and April 1, a maritime storm with gale-force winds occurred, generated by storm Nelson, which impacted the entire Catalan coastline. In the days following the storm, specifically on April 3, 5 and 6, 2024, the ICGC carried out a photogrammetric flight to obtain high-resolution aerial images of the coastline, with a pixel size varying between 10cm and 85% coverage of the coast.
The set of information shown corresponds to the geomorphological cartography carried out through the photointerpretation of aerial images and complemented with other sources of information (press, social networks, fieldwork, etc.). The data is structured in five layers of information:
- Documented information. Collection of the main impacts published in the press and/or social networks and reported by coastal municipalities to the ICGC.
- Field photographs. Photographs of the impact of the storm on the territory taken during the field campaign carried out between March 28 and April 7, 2024.
- Damage to infrastructure. Record of damage identified in the photointerpretation phase and complemented with data obtained from documentary information and/or the field campaign.
- Geomorphological effects. Geomorphological cartography of the most relevant effects triggered by the storm carried out through the photointerpretation of aerial images and comparing them with images prior to the episode.
- Flooded surface. Cartography of the flooded surface identified in the photointerpretation phase and, whenever possible, complemented with data from documentary information or the field campaign.
For more information: March has been very rainy in the northern half of Catalonia, consult the Press Release and Storm Nelson.
Information on coastlines
Layer with coastlines made from photointerpretation of orthoimages from photogrammetric flights carried out by the ICGC in the days following the impact of each storm:
- Coastline of the January 2017 storm obtained from orthoimages taken on January 24. More information.
- Coastline of the January 2020 storm obtained from orthoimages taken between January 24 and February 3, 2020. More information
- Coastline of the March 2024 storm obtained from orthoimages taken between April 3 and 6, 2024. More information.
Maximum flood surface
Layer of the maximum flood surface obtained by superimposing the flooded surfaces of each of the three mapped episodes. This is practically equal to the flooding area of the sea storm with the greatest impact on the Catalan coast, the storm of January 2020 generated by storm Gloria. This area should be considered as the active flooding area for sea storms on the Catalan coast.