Digital soil mapping
Digital soil mapping shows information on different soil properties based on point observations and geostatistical models based on artificial intelligence
Soil mapping has its roots in the need to understand the distribution and characteristics of soils for various purposes, such as agriculture, environmental management, land use planning, and civil engineering, among others.
The demand for soil information has been increasing in recent decades to address emerging environmental issues such as sustainable food production; regulation, adaptation, and mitigation of climate change; soil degradation; land resource management; and in general, the use of the soil resource to carry out any of its systemic functions. Additionally, the richer the soil information, the better the soil assessments that can be made, thus contributing to a better understanding of the environment, with the consequent reduction of risks for decision-making.
The transition from conventional to digital soil mapping approaches is described below, presenting its theoretical framework, and providing an overview of how the latest emerging technologies can be used to generate digital soil mapping.
Transition from Conventional to Digital Soil Mapping Approaches
As early as the fifth century B.C., there are records of efforts to categorize soils, classify them according to their properties, and graphically represent their spatial distribution, such as in the book Yu Gong, 5th century B.C., China. Soil mapping began with observations and maps at local or regional level by farmers, geologists, or other professionals interested in understanding the nature of soil in different areas. These observations were recorded in rudimentary maps indicating the location of different soil types and their characteristics.
The birth of soil science as a modern science took place with the works of Vasily V. Dokuchaev in the 1870s, who understood soil as a natural system with its own genesis and development, relating it to external factors such as climate, vegetation, landscape, relief, and time.
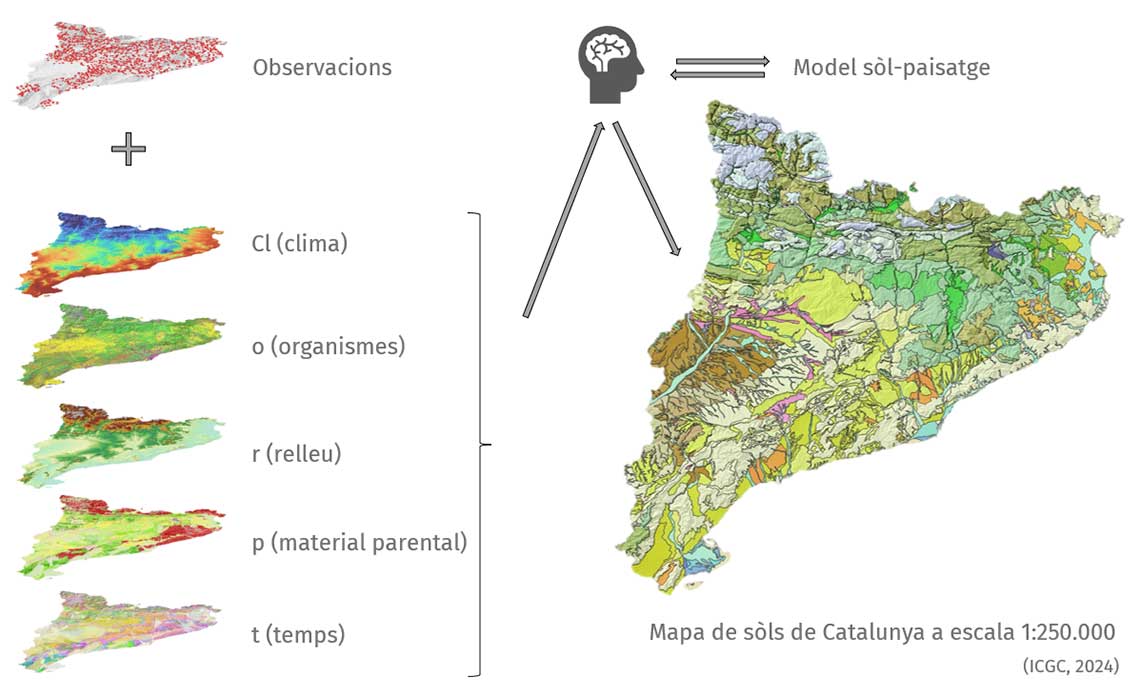
This theory, developed by the Russians from Dokuchaev’s school, particularly by Sergey Zakharov, and imported by the Americans through Curtis Marbut, reached its peak with the publication of the book "Factors of Soil Formation" by Hans Jenny (1941), which became the turning point where the theoretical framework of conventional soil mapping was defined, marking a paradigm shift in soil mapping. Jenny proposed a soil formation model in which soil properties depend on their forming factors, which are climate (cl), organisms (o), relief (r), parent material (p), and time (t), causing all these factors to interact with each other.
This model, called "clorpt," characterizes the environmental conditions for which soils and their properties vary, and how through these variables we can predict their spatial arrangement using modeling that relates soils to the landscape (soil-landscape model).
This development, together with the formalization of taxonomic soil classification systems, such as the "Soil Taxonomy" (Soil Survey Staff, 1975) and the "World Reference Base for Soil Description" (FAO, 1998), represented a significant boost for soil mapping. Classification systems describe how soils are classified based on morphological properties that can be easily measured and quantified in the field.
.

Figure 1.Methodological concept of conventional soil mapping following the clorpt model (Jenny, 1941).
During the Green Revolution, soil mapping and taxonomic classification systems received a significant boost. The need to plan and organize the territory to achieve food sovereignty became a key factor in the development of resource-rich countries. Once this was achieved, many countries reduced funding for soil mapping programs, and many survey teams were disbanded. It was only a few decades later that the problems resulting from the overexploitation of fields became obvious, and the degradation of soils and groundwater became evident. It became clear that soil is a limited and non-renewable resource on a human time scale and, therefore, must be protected from all those aggressions that can degrade it, affecting its functions.
In the last 40 years, Catalonia has made an effort to collect, organize, and interpret soil information from the main agricultural areas. This effort, more or less continuous over time, has provided detailed soil maps for a quarter of the agricultural area, and thousands of soil data points have been acquired from across the territory. All this information has been used, and is still used, to advise and plan land management. Despite all this, soil science advances, and traditional mapping techniques are complemented by more modern ones that incorporate some of the technological potential we have access to today, such as computing, remote sensing, and geographic information systems.
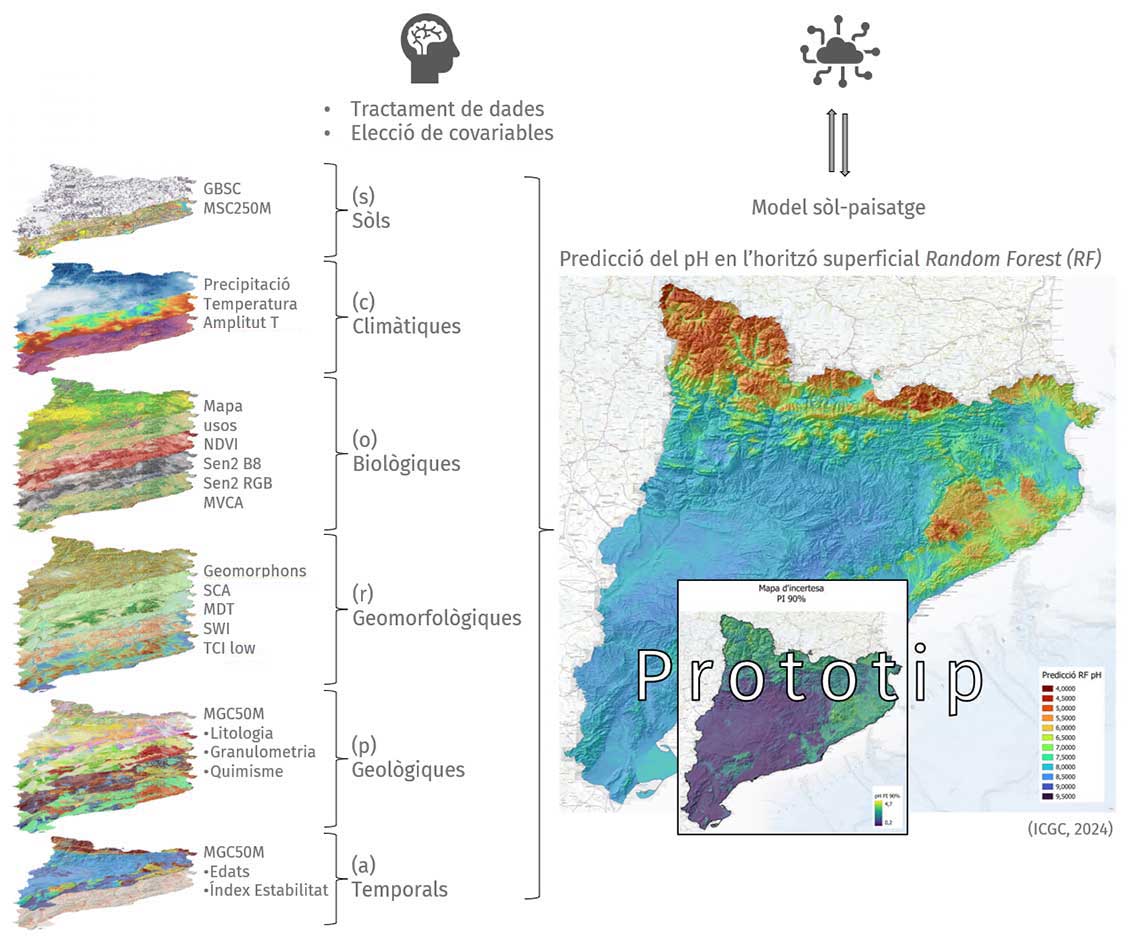
When proposing the complete theoretical transition from conventional soil mapping approaches to digital ones, McBratney et al. (2003) proposed the “scorpan” model as an extension of the “clorpt” model. This model shares the same variables as the “clorpt” model, including climate (c), organisms (o), relief (r), parent material (p), and time/age (a), but to these variables are added the known intrinsic soil properties (s) and georeferencing (n), which gives us the spatial position of a sample and allows us to apply geostatistical principles to the model, thus quantitatively expressing the relationship between a soil property or class and the environmental variables, which we will henceforth call covariates. Here, the individual “scorpan” factors, or a combination of them, are used to predict the distribution of a soil property or soil class of interest, S, using a quantitative function, f(), which represents the relationship between the soil and the landscape..

Figure 2. Methodological concept of digital soil mapping following the scorpan model (McBratney et al., 2003).
Map of organic carbon stocks in agricultural soils of Catalonia
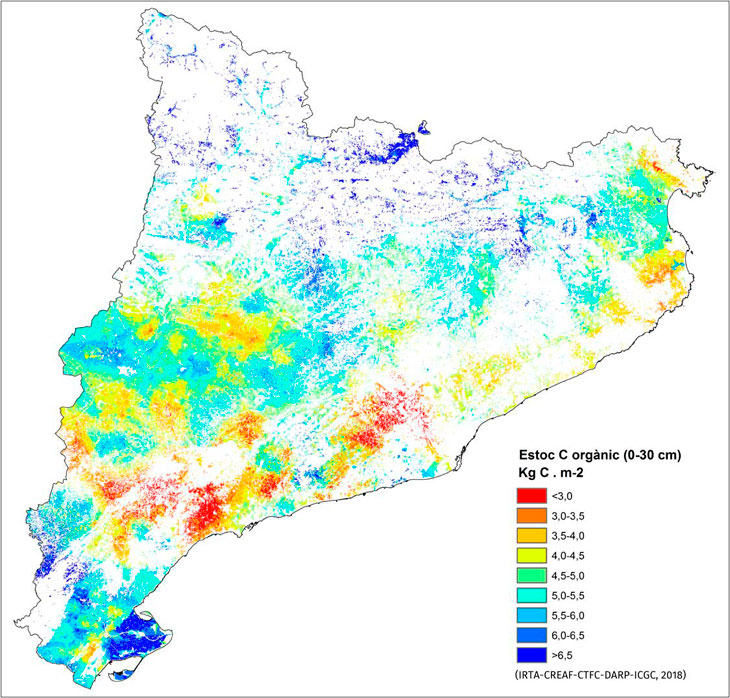
The Map of organic carbon stocks in agricultural soils of Catalonia, the result of collaboration between various organizations in Catalonia such as the Agricultural Research and Technology Institute (IRTA), the Centre for Ecological Research and Applied Forestries (CREAF), the Forest Technology Centre of Catalonia (CTFC), the Department of Agriculture, Livestock, Fisheries and Food (DARP), and ICGC, constitutes a first, and very good, example of what digital soil mapping can mean for Catalonia (Figure 3).

Figure 3.Map of organic carbon stocks in the top 30 cm of agricultural soils in Catalonia (IRTA-CREAF-CTFC-DARP-ICGC, 2018).
Soils represent the third most important carbon reservoir after oceans and geological strata; and much larger than the atmosphere and biosphere combined. The ability of soils to increase their organic carbon contents through the implementation of certain agricultural management practices can be of great interest as a measure to mitigate climate change. This map aims to serve as a starting point for evaluating the effects of implementing possible strategies, policies, and actions to mitigate climate change in line with the suggestions of the United Nations Framework Convention on Climate Change held in Paris in 2015, in accordance with those set by the Catalan Climate Change Office.
The final map has been obtained from descriptive and analytical information from over 7,000 profiles collected since 1983 by the Department of Agriculture of the Government of Catalonia and by the Cartographic and Geological Institute of Catalonia.
As covariables, a series of environmental variables (average annual precipitation and average annual temperature), topographic variables (altitude), management variables (land use and water management: dryland/irrigated), and soil variables (effective soil depth, drainage class, textural class, and clay content) were used.
The statistical approach used the Generalized Least Squares (GLS) method, through the "gls" function of the "nlme" package in the R software. For the selection of the best model, a variable elimination procedure was applied from a complete model (backward stepwise). The criterion for selecting the best model was the mean squared error (Funes et al., 2019).
To spatially represent organic carbon stocks, the regression equation obtained from the layers of predictor variables (in raster format) was applied using map algebra (geographic information systems software). Pixel-level prediction was corrected by adding spatial interpolation of model residuals to correct for spatial correlation. The resulting map has a spatial resolution of 180 m per pixel.
Examples of Digital Soil Mapping Programs
GlobalSoilMap
The GlobalSoilMap.net net project aims to create a new digital map of the world's soils using the most advanced technologies in soil mapping. Led by global academic and research centers, the initiative seeks to improve decisions in food production, climate change, and environmental degradation.
ISRIC plays a central role in coordinating, standardizing, and analyzing soil data collected globally by GlobalSoilMap. SoilGrids is the platform from which they provide the digital soil mapping service worldwide.
SoilGrids — global gridded soil information (ISRIC)
SoilGrids is a system for global digital soil mapping that uses state-of-the-art machine learning methods to map the spatial distribution of soil attributes worldwide.
Other prominent members participating in the GlobalSoilMap.net project, coordinating the collection of regional data, and also having their own digital soil mapping programs include:
- Joint Research Centre (JRC).
- Australia’s National Science Agency (CSIRO).
- Natural Resources Conservation Service (NRCS).
References
FAO, ISRIC and ISSS (1998). The World Reference Base for Soil Resources (WRB).
Fernandez-Ugalde, O; Scarpa, S; Orgiazzi, A.; Panagos, P.; Van Liedekerke, M; Marechal A.; Jones, A. (2022). LUCAS 2018 Soil Module. Presentation of dataset and results, EUR 31144 EN, Publications Office of the European Union, Luxembourg. ISBN 978-92-76-54832-4, https://doi.org/10.2760/215013, JRC129926.
Funes, I., Savé, R., Rovira, P., Molowny-Horas, R., Alcañiz, J.M., Ascaso, E., Herms, I., Herrero, C., Boixadera, J., Vayreda, J. (2019). Agricultural soil organic carbon stocks in the north-eastern Iberian Peninsula: Drivers and spatial variability. Sci. Total Environ. 668 , 283–294. https://doi.org/10.1016/j.scitotenv.2019.02.317.
ICGC (2016). GeoBase de dades dels Sòls de Catalunya (GBSC) v1.0. Institut Cartogràfic i Geològic de Catalunya, Generalitat de Catalunya.
Jenny, H. (1941). Factors of Soil Formation. A System of Quantitative Pedology. Ed. Mc. Graw-Hill, USA. 281 p.
Llorente, M.; Rovira, P.; Merino, A.; Rubio, A.; Turrión, M.B.; Badía, D.; Romanya, J.; González, J.; Cortina, J.A. (2018): The CARBOSOL Database: a georeferenced soil profile analytical database for Spain [dataset publication series]. PANGAEA, https://doi.org/10.1594/PANGAEA.884517.
McBratney, A.B.; Mendonça Santos, M.L.; Minasny, B. (2003). On digital soil mapping. Geoderma. Vol. 117 (1–2): 3-52. https://doi.org/10.1016/S0016-7061(03)00223-4.
Orgiazzi, A.; Ballabio, C.; Panagos, P.; Jones, A., Fernández-Ugalde, O. (2018). LUCAS Soil, the largest expandable soil dataset for Europe: A review. European Journal of Soil Science, 69 (1): 140-153. https://doi.org/10.1111/ejss.12499.
R Core Team (2013). R: A language and environment for statistical computing. R Foundation for Statistical Computing, Vienna, Austria. URL: http://www.R-project.org/.
Soil Survey Staff (1975). Soil Taxonomy. A Basic System of Soil Classification for Making and Interpreting Soil Surveys. U.S.D.A. Agricultural Handbook, 436.