Foreword
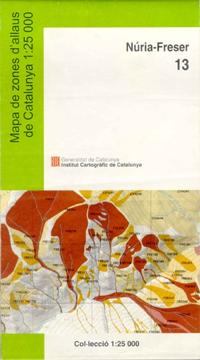
Avalanche mapping is one of the priorities of the ICGC's avalanche group. For this purpose, between 1996 and 2006 the Avalanche Paths Maps were drawn up. The collection includes 14 maps with a scale of 1:25.000 covering the Catalan Pyrenees. All of these maps have been published.
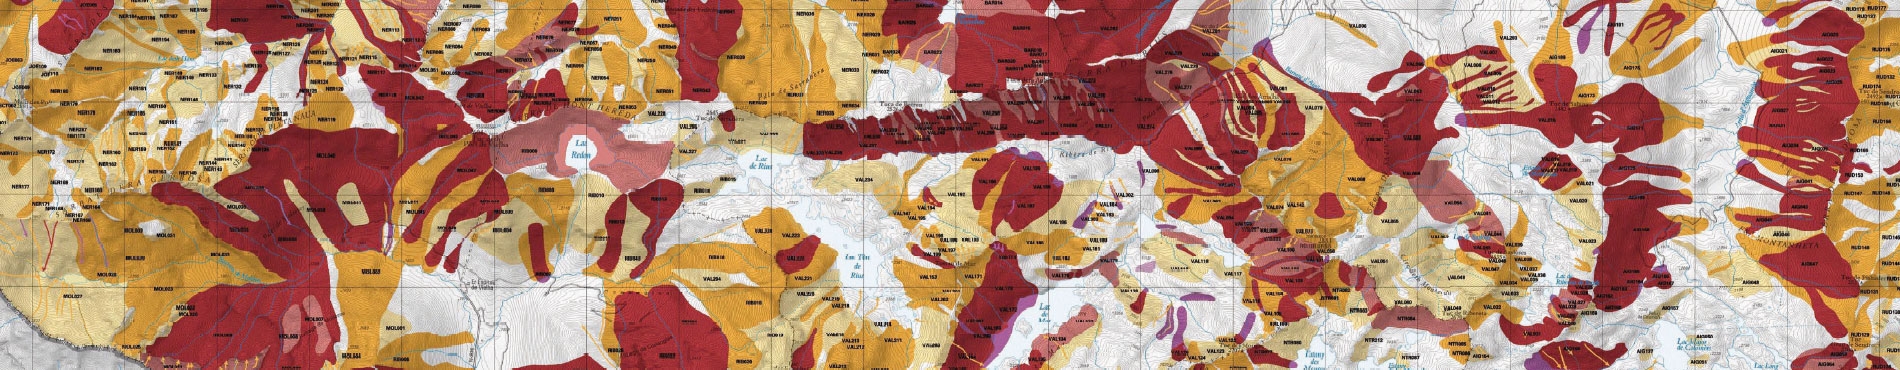
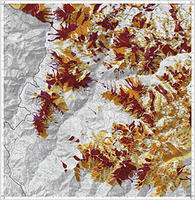
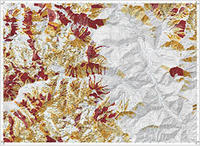
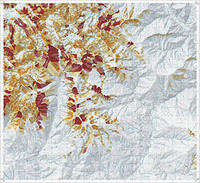
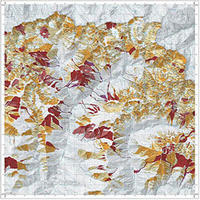
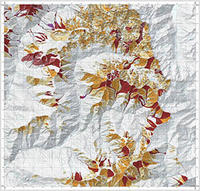
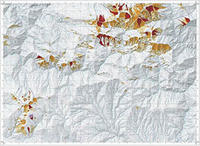
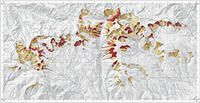
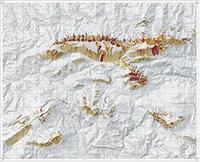
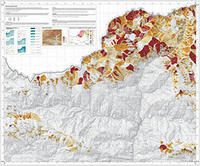
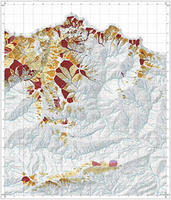
The Avalanche paths maps 1:25.000 are thematic maps on which the areas that could be affected by avalanches are represented. An avalanche path is one where, over time, avalanches of different dimensions have been triggered. Its boundaries are based on the maximum avalanche that can be determined from existing indicators (geomorphological, vegetation and historical).
The preparation process of these maps consists of three stages:
- Photo-interpretation: this consists of the interpretation of vertical aerial photos and orthophotomaps taken when there is no snow, so that the morphology of the slopes and the different types of vegetation affected by avalanches can be better observed. Aerial photographs allow a global view of each avalanche path. Through observing characteristics of morphology, roughness of the terrain and vegetation, and with the help of slope maps obtained from the altimetric database, the boundaries of the zones affected by avalanches are established. Each of the maps shows the flights used for photo-interpretation.
- Interpretation in the field: this consists of identifying and describing the avalanche zones previously defined by photo-interpretation. This is carried out when there is no snow so as to correctly observe the slope's morphology. The field observation of detailed characteristics that cannot be discerned from aerial photos allows the delimitation of these avalanche zones to be completed, particularly with regard to their runout zones. The morphological description of each avalanche zone is included in the Avalanche database.
- Population survey: this involves carrying out a survey among the population to obtain information about the different avalanche incidents (type, frequency, period of incidents, etc.), and their boundaries. This information comes from witnesses in the area, bibliographies, archives, data from the ICGC's nivo-meteorological observation network, countryside wardens and hikers in general. There are, however, areas that are scarcely inhabited and/or rarely visited where there is clearly a lack of information. This information is also included in the avalanche database.
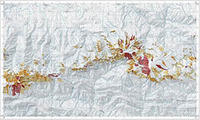
All of the information is represented in the following way on the maps: the avalanche zones determined by photo-interpretation and field interpretation are shown in orange and the areas determined by surveys are shown in purple. Where the information overlaps, the colours are layered and result in a burgundy colour. The slide or small avalanche paths and those where it is difficult to individualise the avalanches, are represented by the same colours but in a lighter shade.

 Contact