
 Contact


The Map for the prevention of geological risks (MPRG25M) is a document that represents the geological hazards in the territory on a scale of 1:25 000. It is a multi-hazard map, which provides an overall view of the hazards identified in the region. The territory is divided into zones, for each hazard considered, of high, medium and low risk, and is represented according to traffic-light colours. The symbols used allow the type of phenomenon causing the threat to be identified, as well as representing the phenomena and indicators of said hazard.
Why create a risk prevention map?
The purpose of MPRG25M is to provide support to territorial planning. The delimitation of zones with geological hazards provides a view on a scale of 1:25 000 of the dangers in the territory, so they can be taken into consideration for planning.
How is it created?
1. Inventory mapping
The mapping of phenomena and indications of activity is done based on information obtained from the gathering and analysis of historical documentation available; the analysis and interpretation of old and recent aerial photographs, and of orthophotos and images; fieldwork, and interviews with people from the area.
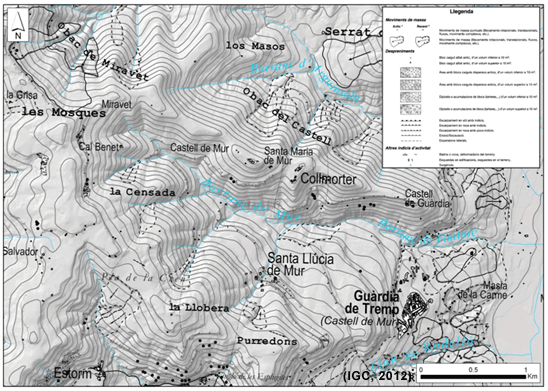
Part of the inventory of phenomena from Vilamitjana 290-1-1 (65-23)
2. Determining susceptibility
The areas susceptible are delimited by both zones where a phenomenon could occur, the start zone, and those that could be affected by its path and runout zone. The delimitation of these zones of susceptibility is done based on the inventory of phenomena, indications of activity and geomorphological signs, and on the identification of the favourable lithologies and morphologies of the terrain. This stage includes the preparation of numerical support modelling to determine the start zones and the scope.
3. Determining the threat
Areas susceptible are classified according to their level of hazard, based on the analysis of the intensity and frequency of the observed or potential phenomena. For each phenomenon the intensity varies and is determined based on the dimensions and energies expected, whilst the frequency is determined according to the inventory of phenomena and indications of activity. The threat is represented in three levels: low, medium and high, represented by yellow, orange and red, respectively. The unidentified danger is left uncoloured.
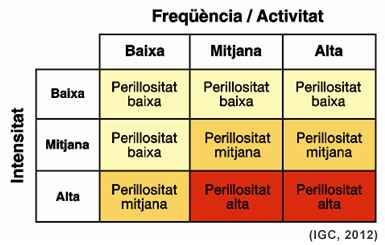
Risk matrix
What does it consist of?
Each sheet has various windows where the information is represented on different scales. The central element of the sheet is the main map. Around it are the elements that correspond to complementary maps and additional hazard maps, as well as their legends and explanatory texts.
On the MPRG25M the phenomena and indications of activity are shown, together with the natural hazard of processes generated by external geodynamics, such as floods, slides, falls, torrential flows, collapses and avalanches, and by internal geodynamics, such as earthquakes. The map does not include those areas susceptible to the occurrence of hazards generated by anthropic causes. The phenomena included are: slope movements (slides, falls, torrential flows, complex movements,…), collapses (sinkholes and subsidence), avalanches, flooding and seismicity. The main map, on a scale of 1:25 000, represents the slope movements, collapses, avalanches and potentially floodable zones determined based on geomorphologic criteria (ZPISCG).
The complementary maps, on a scale of 1:100 000, show the hazard of each of the phenomena represented on the main map separately, to facilitate comprehension. According to the number of types of phenomena represented on the main map, there are between 1 and 5 complementary maps. The additional hazard maps correspond to flood and seismic hazards, both on a scale of 1:50 000.
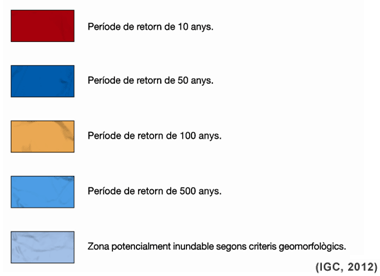
The flood hazard map includes the hydraulic modelling for different return periods considered (10, 50, 100 and 500 years) and the flood zone according to geomorphologic criteria.
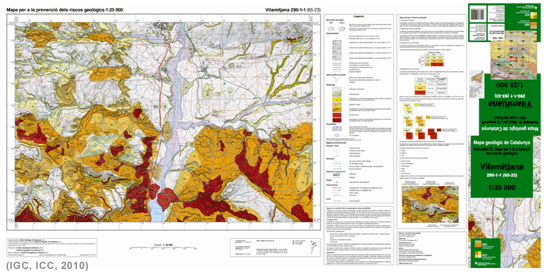
Map for the prevention of geological hazards 1:25 000. Vilamitjana 290-1-1 (65-23) sheet
How to read it
The legend on the geological risk prevention map allows the different types of phenomenon found in the territory to be identified, and their threat.
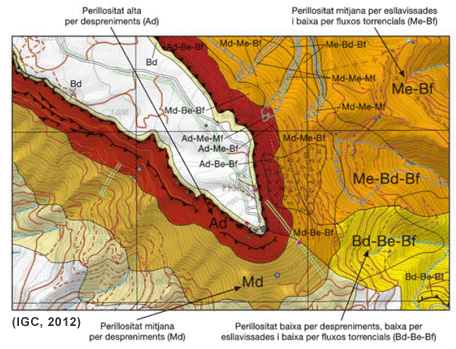
The hazard is represented in three levels: low, medium and high, represented by yellow, orange and red, respectively. The unidentified hazard is left uncoloured. Given that there could be hazard that overlap, a colour code is established enabling the identification of these overlaps, indicating which is the more dangerous risk. This is represented in the following way:
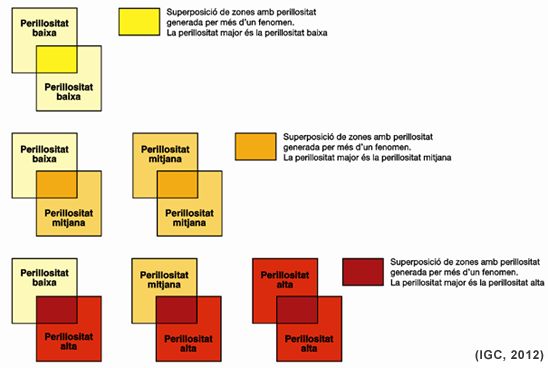
The hazard is classified in 3 degrees: low, medium and high, represented in yellow, pumpkin and red, respectively.
Under no circumstances are hazards grouped, the map only indicates that they overlap. To identify which phenomena and which hazards corresponds to each of the zones of susceptibility, a letter code has been established identifying the overlapping phenomena and their threat..
The epigraph defining the threat is:
- B: Low (baixa in catalan)
- M: Medium
- A: High (alta in catalan)
The epigraphs defining the phenomena are:
- d: falls
- e: slides
- f: flows
- a: avalanches
- es: collapses
The combination of these epigraphs for hazard level and type of phenomenon provides the hazards and its overlaps.
Example of an epigraph combination
1. Seismic hazard map
The seismic hazard map is obtained based on the Map of seismic zones for average soil (ICC, 1997) for a return period of 500 years, and takes into consideration expansion due to soil effects, understanding soil from the viewpoint of seismic engineering. To quantify the expansion of the seismic movement due to soft soil, the lithologies of the Geological Map of Catalonia 1:25 000 have been classified according to the geotechnical classification suggested by Fleta et al. (1998). This classification is associated with the speed of S waves travelling through different materials.
The following types are defined:
- Type R: hard rock (e.g. Paleozoic and Mesozoic rock).
- Type A: compact rock (e.g. Paleogenic and Neogenic rock).
- Type B: semi-compact materials (e.g. evaporatic strata and old Quaternary sediment).
- Type C: uncohesive materials (e.g. non-consolidated materials with organic content).
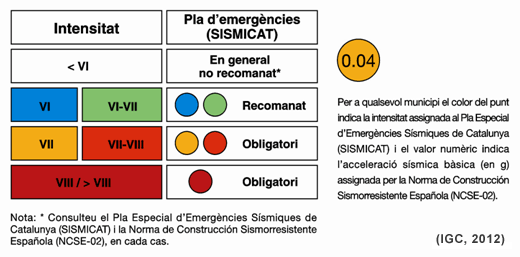
According to the soil type expansion does or does not occur. This expansion consists in adding 0.5 grades of intensity to the Seismic Hazard Zone Map intensity for average soil of type B and C. For types R and A no additional intensity is added, as expansion does not occur. The final intensity obtained determines the level of seismic hazard.
The resulting map is the Seismic hazard map, which considers the soil effect for a return period of 500 years. The basic seismic acceleration values of the Spanish Earthquake Resistant Construction Regulation (NCSE-02) are also represented on the map, for construction on rock, which is mandatory, and the intensity considered by the SISMICAT Emergency Plan.
Legend of the seismic hazard
2. Flood hazard map
The flood hazard map, on a scale of 1:50 000, represents the limits of the hydraulic modelling for different return periods of 10, 50, 100 and 500 years, provided by the Catalan Water Agency (ACA). For smaller courses, for which hydraulic modelling has not been performed, the limits of the potential flood zone determined according to ICGC geomorphologic criteria (ZPISCG) are represented. The delimitation of ZPISCG is done based on photo-interpretation and fieldwork, and a priori ZPISCG is considered to include the entire flood plane (T0) and the first terrace (T1), whilst older terraces are interpreted as non-flooding.
Legend of the flood risk
