Bathymetry
Bathymetric measurements of the seabed from sonar and lidar data and measurements of the land surface from topography, images and aerial lidar data
The Catalan Coast is a territory of great natural and economic value, with great biodiversity and strategic relevance for various human activities. To ensure effective management of this area, it is essential to have accurate bathymetric data on the seabed, which allows a better understanding of its morphology and the identification of marine habitats.
The ICGC has generated a series of bathymetric products of the Catalan coast on behalf of the Directorate General of Environmental Policies and the Natural Environment and has been co-financed by the European Maritime and Fisheries Fund 2014-2020 (EMFF). These products are a topobathymetric elevation model and a bathymetric orthoimage in raster format, and a contour map and a coastline in vector format. All of this has been prepared from different sources of information: bathymetric measurements of the seabed from sonar and lidar data and measurements of the land surface from topography, images and aerial lidar data, carried out during the years 2022, 2023 and 2024.
The topobathymetric elevation model shows us the relief of both the emerged part of the coast up to about 50 m away from the coastline, and of the submerged part up to a depth of 50 m, with a resolution of 1 m.
The isobath map shows us the relief with an equidistance between curves of 1 m.
The coastline shows us how far the emerged part reaches at the time of the measurements made to make the models, and also classifies the characteristics of the terrain found along the coast.
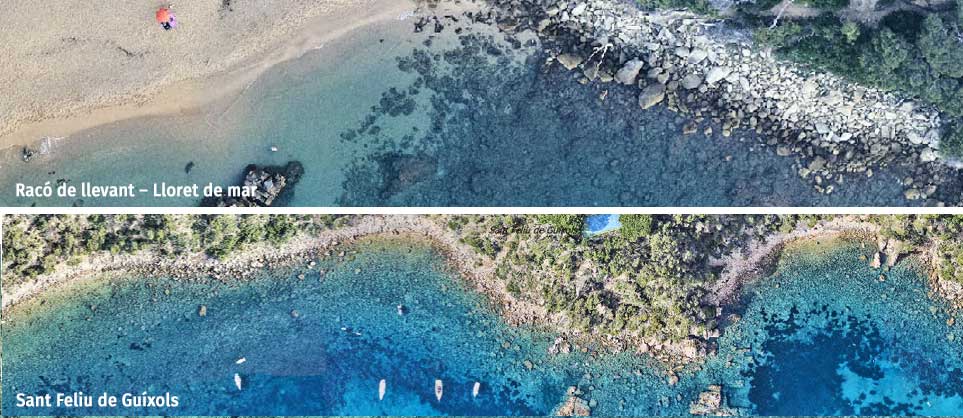
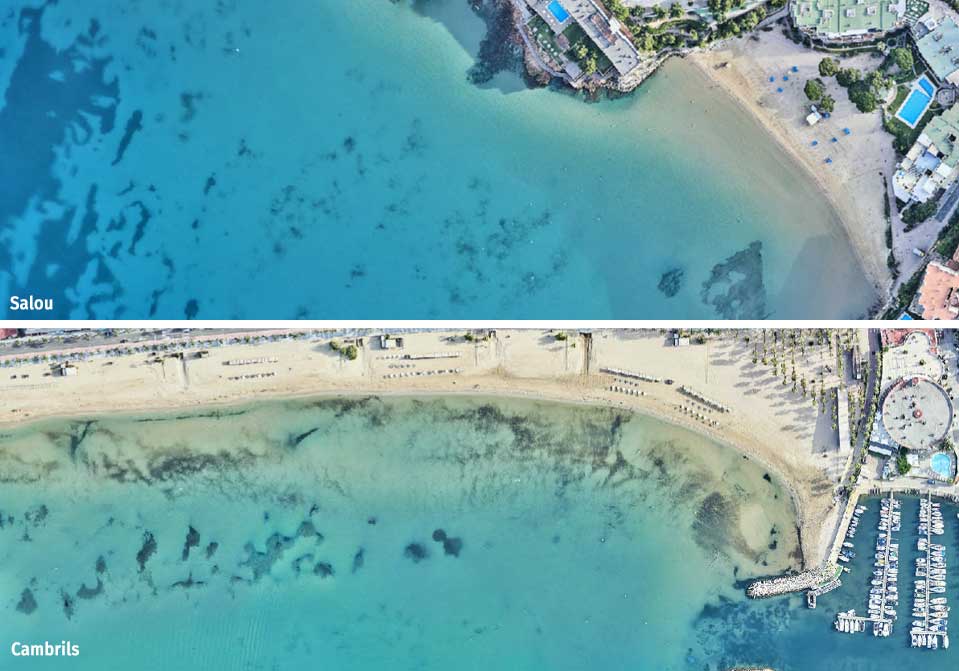
Finally, the bathymetric orthoimage shows us in great detail the underwater morphology, in addition to the first few meters of the surface.
All this data is intended to serve as a basis for effective management of the coastal zone.
Last update: 06/2025.
Imatge
| Geoinformation from the Cartographic and Geological Institute of Catalonia subject to a Creative Commons International Recognition 4.0 license More information |
Description
Topobathymetric Model
The Topobathymetric Model is a regular grid of points that describe the morphology of both emerged and submerged terrain. In addition to the terrain, the model includes rigid structures such as buildings, breakwaters, retaining walls, etc. Vegetation, vehicles, bridges, and other elements with a lesser impact on water dynamics are not considered. Each point contains the orthometric elevation in meters of a 1x1 m terrain cell. This means that points above the geoid surface have a positive elevation, and points below it have a negative elevation. This distinction roughly coincides with emerged and submerged points, respectively.
Just as contour lines on a topographic map connect points of the same altitude, isobath lines connect points of the same depth beneath the water surface. This is a graphical representation that allows for visual identification of areas of the seafloor with greater or lesser slopes and the presence of mountains, depressions, troughs, and submarine spurs.
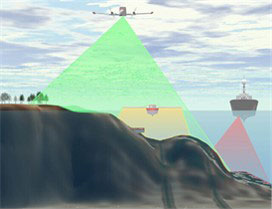
Most of the bathymetry, totaling between 0 and -15 m, was captured in the summer of 2022 using airborne LiDAR with bathymetric capabilities. Unlike terrestrial LiDAR, bathymetric LiDAR has a wavelength that allows it to penetrate shallow waters and obtain seafloor data. This technique yields excellent results at a very low cost and has been used wherever possible. The two main exceptions are the area of influence of Barcelona air traffic control due to low-altitude flight restrictions and the Fangar Pass in the Ebro Delta, due to the abundance of suspended sediments that interfere with the bathymetric LiDAR signal.

Geographic distribution of data capture.

Data capture.
Submerged terrain areas that could not be captured using bathymetric LiDAR were captured using echosounders. Echosounders are instruments similar to ship-based sonars that allow the distance from the ship to the seafloor to be determined from the propagation time of an acoustic wave through the water. The shallowest areas, between 0 and -3 m, were captured mainly using single-beam echosounders from unmanned surface vessels (USVs). The deeper areas, between -3 and -50 m, were captured using multifaceted echosounders from manned vessels. To complement echosounding along the intertidal zone, between +1 m and -1 m, topographic profiles were created to ensure a smooth connection between emerged and submerged terrain. Finally, to obtain information on the emerged areas of the topobathymetric model along the central coast, data from a land-based LiDAR flight were used. The capture characteristics are equivalent to those of territorial LiDAR.
The result of primary data capture is an irregular point cloud of highly variable density. To generate a continuous topobathymetric model, the point cloud must be refined. First, noise is removed and the points are classified to distinguish those that will be included in the model (seafloor, terrain, buildings, breakwaters, outfalls, etc.) from those that will not (vegetation, vehicles, suspended sediments, water surface, ships, etc.). Furthermore, given the diversity of capture technologies used, it is necessary to standardize the data sources to avoid discontinuities and gaps that do not address any terrain characteristics. Once the point cloud has been refined, a continuous surface is triangulated, the holes where it was impossible to obtain seafloor information are interpolated, and the final model is generated in raster format.
Orthoimage
A high-resolution bathymetric orthoimage has been produced that covers a wide stretch of the Catalan coastline, specifically from the Ebro Delta to El Vendrell, and from Sant Andreu de Llavaneres to Cap de Creus. This orthoimage has been generated using bathymetric LiDAR technology, which combines laser sensors and cameras to obtain precise data on both the land surface and the seabed in areas of clear, shallow water.
Bathymetric orthoimages are georeferenced visual representations that show underwater morphology in great detail. With a spatial resolution of 5 centimeters, these full-color images allow different types of marine substrate, such as rocks, sand or underwater vegetation, to be clearly identified. This discrimination capacity is particularly useful for environmental studies, coastal planning, marine habitat management and scientific or educational activities.
In order to optimize the visualization of the seabed, the histogram of the images has been adjusted. This image correction process prioritizes underwater clarity, although this may lead to a loss of detail or overexposed areas in adjacent land areas. This technical decision is made with the aim of maximizing the readability and usefulness of the bathymetric information.
Bathymetric coastline
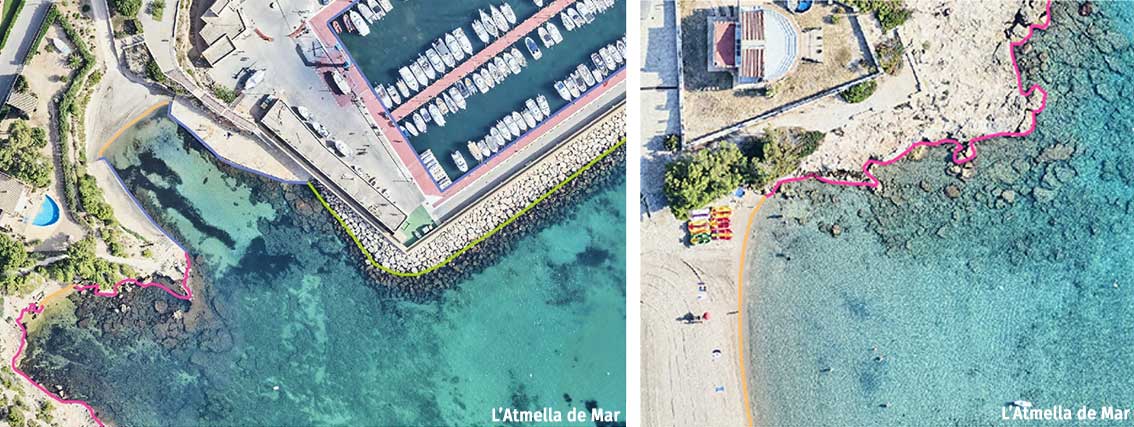
The coastline defines the boundary between surface and submerged land for a given date that approximately coincides with the origin of the altimetric reference system. Waves, tides and changes in the terrain throughout the same data capture mean that this line must necessarily be an approximation, especially in areas of shallow depth and sediment accumulation such as the Ebro Delta.
The bathymetric coastline has been traced through photointerpretation of the boundary between land and sea, using high-resolution bathymetric orthoimages (10 or 15 cm) generated by the ICGC, and where there is no bathymetric orthoimage, it has been drawn from the coastal coverage flight of autumn 2022, allowing a detailed and precise representation of the coastline.
The "coastline" product is a vector file that represents the contour of the coast. Each section includes information on the type of terrain that is described by indicating one of the following typologies:
- Sand: sand on beaches regardless of granulometry.
- Rock: natural rocks.
- Breakwater: Artificial rock constructions.
- Quay: port construction.
- River: line of the river's mouth into the sea.
Each section is also associated with the date on which the image used to draw it was captured. This allows the user to easily know the date associated with each segment of the coastline.
Main technical features
All products derived from the bathymetry of the Catalan coast are distributed in the form of mosaics without subdivision by sheets. The coordinate system adopted is the official one in Catalonia: ETRS89 reference system and orthometric elevations using the EGM08D595 geoid model.
Distribution characteristics:
- The topobathymetric model is distributed as a single raster file in 32-bit Cloud Optimized GeoTIFF (COG) format with a 1 m grid spacing, internal georeferencing, pyramids and lossless LZW compression.
- The contour maps and the coastline are distributed as a single vector data set in different formats (ESRI Shapefile and OGC GeoPackage). In the case of contours, the equidistance is 1 m and each element contains an attribute “COTA” with the elevation associated with the contour in meters; in addition, rendering styles are included highlighting master curves with an interval of 10 m. As for the coastline, it contains attributes that indicate the type of terrain of each section.
- The bathymetric orthoimage is distributed in ECW compressed image format and also in Geopackage format.
Capture dates and capture technologies:
- The capture with bathymetric LiDAR was carried out during the summer of 2022 and covers most of the Catalan coast, specifically between the Ebro Delta and Calafell Beach in the south and between Mataró and Portbou in the north.
- The capture with terrestrial LiDAR was carried out between December 2022 and January 2023 and includes the emerged part of the central coast between Calafell Beach and Mataró.
- The capture with multibeam echosounder from a manned vessel was carried out between late 2021 and early 2023 and covers the entire stretch between -10 and -50 m, some areas of the central coast between -3 and -10 m and most of the Alfacs Bay.
The capture with singlebeam echosounder from an unmanned vessel (USV) was carried out between 2022 and 2023. It includes shallow areas (0 to -3 m) of the central coast and the Ebro Delta. - The topographic profiles of the intertidal zone of the central coast were carried out between 2022 and 2023.
Ptreparation
Topobathymetric model
To develop the final topobathymetric model, first the noise associated with the initial data capture is reduced to improve its accuracy. Then, the differences between capture technologies are minimized to achieve a uniform texture and a more homogeneous model. Artifacts are also eliminated, identifying the elements of the territory and eliminating others, such as suspended sediments, posidonia or ships, which can distort the result. Finally, the holes that remain in the areas without data are interpolated, applying specific techniques according to the size of the hole to complete the model.
Bathymetric orthoimage
Orthophotos are generated from the geometric rectification, by direct orientation, of the images obtained by a photogrammetric aerial camera. For this rectification, the terrain elevation model derived from the Territorial Topographic Reference or another one of similar or better precision is used.
In case of detecting the presence of foreign bodies that may have originated during the orthophoto generation process or during the acquisition of the images, if these are very evident or prevent the interpretation of relevant elements in the dynamics of the coast, digital make-up tasks are carried out.
Coastline
The coastline and its classification are obtained through photointerpretation, with the exception of ports, where the delimitation comes from the Territorial Topographic Reference (or the old 1:5,000 Topographic Base).
More specifically, the line is drawn with the following criteria according to the type of terrain:
- In sandy areas (regardless of the grain size): Where dry sand borders wet sand at the moment the photograph was taken.
- In rocky areas: Where rocks border the water at the moment the photograph was taken.
- In breakwaters, breakwaters or defences: Where artificial rocks border the water at the moment the photograph was taken.
- In piers: The corresponding line is obtained from the Territorial Topographic Reference (or the old Topographic Base 1:5,000) and, if any new pier is detected in the photographs used, it is digitized. Piers that are not fixed are not collected.
- In river mouths: Adjacent lines (of sand, rock, etc.) are joined, without giving them shape.
Islands, islets or stones that are not connected to the coastline are not collected. On the other hand, breakwaters that are not linked are collected.
Featured use cases
Topobathymetric model
 Topobathymetric models are the basis for geoinformation that allows for the generation of derivative products such as isobath maps with various equidistances. They can also be used as a final product for simulations such as flood risk analysis, storm effects, sediment transport, volumetric differences in beach sand between different dates, etc.
Isobates are the basic information for maritime charts. The published isobath map lacks the necessary elements for maritime navigation. It is derived from the topobathymetric model and represents the same information but expressed using isobaths, or lines that join points of equal depth, so that this information can be analyzed in vector format.

Bathymetric orthoimage
This type of cartographic product is a very valuable resource to complement the digital topobathymetric elevation model, as it provides a visual dimension that facilitates the interpretation and analysis of the underwater relief.


Coastline
Coastal dynamics due to sediment transport, waves, changes in sea currents, wind and human actions to transform ports and beaches, among others, are factors that continuously modify the actual layout of the coastline. Having coastlines from different periods allows studies to be made of the movement of receding and receding coastlines due to these coastal dynamics.
On the other hand, having an updated coastline allows for better management of the territory. For example, the coastline is necessary in the case of urban planning or beach management.
