
 Contact


Graphical representation, in a vertical plane, of the interpretation of the disposition of the materials in the subsurface
A geological cross-section is a graphic representation of the intersection of the geological bodies in the subsurface with a vertical plane of a certain orientation. It is a section of the terrain where the different types of rocks, their constitution and internal structure and the geometric relationship between them are represented. It is an approximate model of the real distribution of the rocks in depth, consistent with the information available on the surface and the subsurface. It can also represent the extension of the materials of the structures that have been eroded above the topographic surface.
The cross-sections are an indispensable complement of the geological maps; maps and cross-sections are fruit of the interpretation of the arrangement of the rocks using diverse types of data, normally incomplete and with different degrees of uncertainty. Both are bi-dimensional representations of the geological reality and jointly allow us to understand the tri-dimensional structure of the rocky volumes and, in consequence, the geological history of a zone.
The geological cross-sections have a very relevant economic and social importance. They are the basis for planning engineering works, fundamentally the lineal works that affect the surface and the subsurface (roads, tunnels, utilities) and for the exploration and production of geological resources: water, stones, minerals and energy.
Construction of a geological cross-section
The construction of a geological cross-section involves the interpretation of the rocks arrangement, both in depth and on the topographic surface. This consists of interpolating all the available data, of surface and subsurface, with the objective of building a coherent geological model. For this reason, the construction of the geological cross-sections requires the application of all the knowledge of the geological characteristics of the region, interpreted within the framework of the theoretical knowledge of the moment.
The data on the surface are obtained directly on the field (direction and dip of the strata or other structures, types of contact, thickness of the stratigraphical units, lateral relationships between them, etc.) (figure1) or they are extracted from an existing geological map (geological formation or cartographic unit, type of rock, angle of the intersection with the topographic surface, spot data).
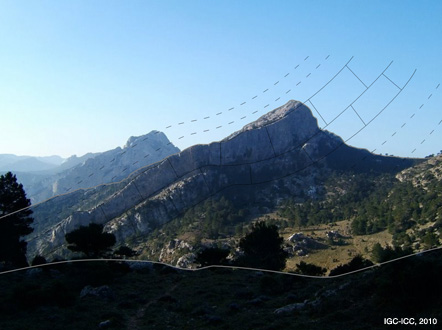
Figure 1: Geological cross-sections can be constructed by direct extrapolation from the observations on the surface. Frequently, the geological interpretation of the landscape gives sufficient information for constructing a geological cross-section, especially in gorges. The figure shows the extension of the subsurface and over the topographic surface of a limestone section and of the rocks that crop out below and above it. The reach in depth is relatively limited.
Without doubt, the quality and the precision of the geological cross-section are directly related to a good base of geological cartography which allows deducing the tri-dimensional arrangement of the rocks, the temporal relationships between them and the geometry and the age of the structures that affect them. The geological map permits us to know and delimit the areas characterized by the same type of structures, this is called “the structural style” (figure 2).
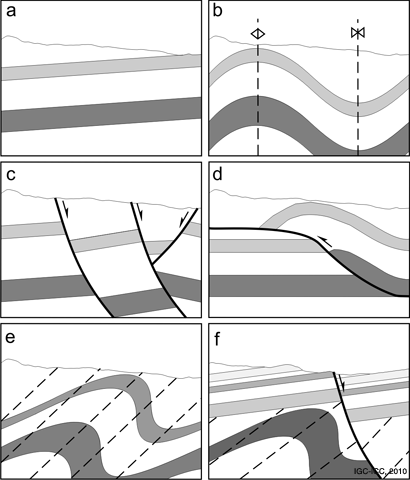
Figure 2: These figures show, schematically, the most common “structural styles”. a) horizontal planar or with slightly dipping bedding, b) folds, c) normal, extensional faults, d) thrusts, contractive faults, e) folds with associated cleavage. In the same area, several “structural styles” can often be recognized, as for example, fold structures in the basement over which sedimentary materials of flat structure are superimposed and the whole being affected by extensional faults (f).
The maximum amount of subsurface data is necessary in order to restrict the possible interpretations and to systematically apply basic geological concepts. The subsurface data are obtained directly from the recovery of drilling cores carried out at a certain point (photo 1), or indirectly, using the geophysical methods that analyze the distribution of the physical properties of the rocks measured from the surface (figure 3) or from the interior of wells. Among the most common are the vertical electrical soundings (VES) which register the differences of electrical conductivity and are very much used in the prospection of groundwater.
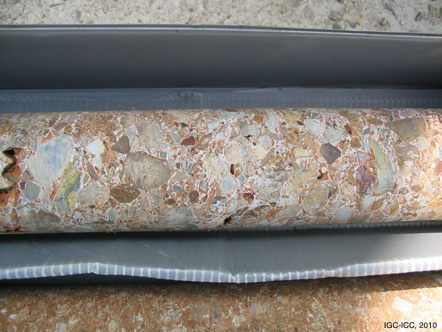
Photo 1: The recovery of continuous drill cores allows us to know first hand the constitution and the thickness of the subsurface rocky units.
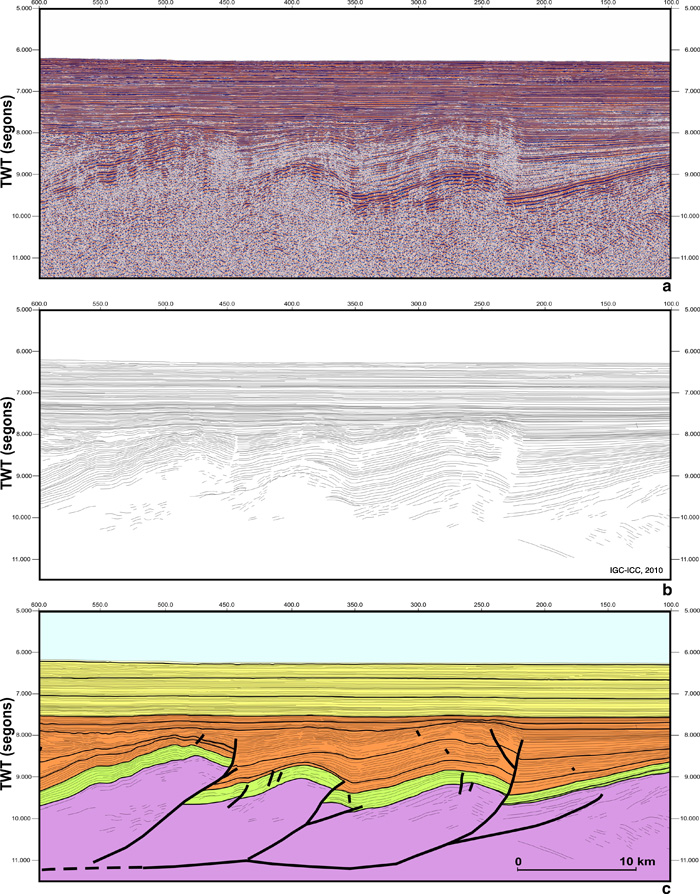
Figure 3: The geophysical techniques give information about the physical properties of the rocks of the subsurface. The figure shows a seismic profile (a) in which the so-called reflectors can be observed: these are the response to seismic waves by horizons reflecting them. They give an image similar to that of a clinical ultrasound. The vertical scale of the seismic profiles refers to the time the seismic waves take to go from an emission source situated on the surface, to a horizon that reflects them and back in order to be registered by a receptor; the time of this vertical scale, graduated in milliseconds, is a two way travel time (TWT). To be able to transform the vertical scale in TWT of the seismic waves into a vertical scale in meters is necessary to know the density of the medium through which the waves move and their speed. In order to determine these parameters other geophysical techniques are used, generally refraction method or gravimetry supported, whenever possible, by boring data. The line drawing (b) identifies the reflectors which can be observed in the seismic profiles and shows the disposition of the rocky formations in the subsurface. Finally the interpreted profile (c) is constructed.
The quality and the realization costs of the geological cross-sections are closely linked to the regional geological knowledge; even so, as already commented in the section dedicated to geological cartography, from the construction of geological cross-sections geological theory is also deduced.
The construction of a geological cross-section requires the consecution of a series of steps and the application of specific techniques for its validation. In order to reduce the degrees of interpretation of the rocks arrangement in depth to a minimum and to ensure the reliability of the cross-section, geometric techniques which permit the correct integration of the greatest possible amount of data are used, (figure 4), since it is necessary to avoid the accumulation of errors in the various stages of construction of the cross-section, especially in the early stages. So, in the areas with a simple, flat structure, with low and constant dips of the stratification, the scope of the extrapolation of data is much wider. On the other hand, in areas with folds, normal faults or thrusts it will be necessary to apply some restrictions in accordance with the geometric models typical of each structural style.
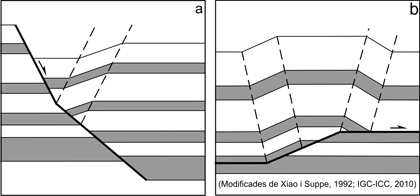
Figure 4: The extrapolation of data, both of the surface and the subsurface, is limited by the “structural style”; the figure illustrates geometric models of extensional (a) and contractive (b) faults.
The projection of the surface and subsurface data over the cross-section plane is the critical phase during the construction of a geological cross-section. To do this, a tri-dimensional geometric model, adjusted to the orientation of the diverse surfaces, should be defined, given that the data can only be projected on the cross-section plane in parallel to the structures.
The vertical scale of a geological cross-section should always be the same as the horizontal scale in order to avoid the deformed representation of the geological bodies. In the cross-sections that accompany a geological map it is even more important that both scales are the same in order to facilitate the comparison and the integration of the information. There are cases in which the graphic representation of the geological configuration in maps and in cross-section is very similar, for example when the geological structures are found to be steeply inclined. So, the image of the geological cross-section of any object inclined 45º, such as a fold with plunging axis, is the same as that of a cross-section according to a horizontal plane and very similar to its cartographic representation.
When one wants to represent the cross-section of recent deposits, or of relatively thin ones, it is necessary to exaggerate the vertical scale of the cross sections (figure 5). This representation system is that used in the linear works projects (figure 6), in which all the objects of the subsurface, natural or built by man, are exaggerated in order to make reading easier.
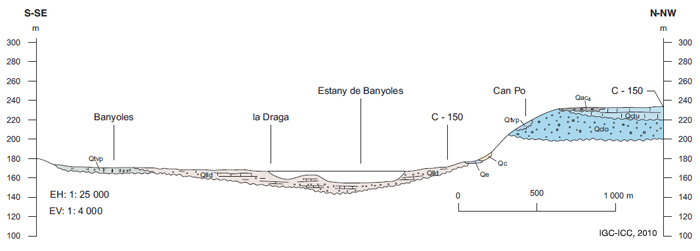
Figure 5: In areas with recent deposits, Pleistocene and Holocene, the specific geologic cross sections of these are constructed with the exaggerated vertical scale. This one, in particular, shows the travertines and carbonate muds of the Lake of Banyoles (Geological Map of Catalonia 1: 25.000).
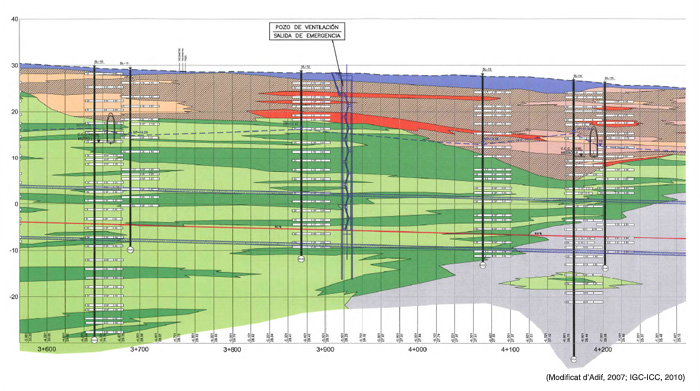
Figure 6: Geological section of an underground work project in urban subsoil. The vertical scale and consequently the height of all objects is vertically exaggerated.
The depth to which the cross-sections are built depends on the work scale, the geological characteristics of the zone, the objectives of the cross-section and the available data on the subsurface. Therefore, for example, the geological cross-sections that accompany the general geological maps, and made using the data of the surface, have a depth which oscillates between some hundreds or some thousands of metres. In areas where information from hydrocarbon exploration campaigns, mainly borings (figure 7) and reflection method (figure 3), the depth of the cross-sections reach up to 6 or 7 kilometres.
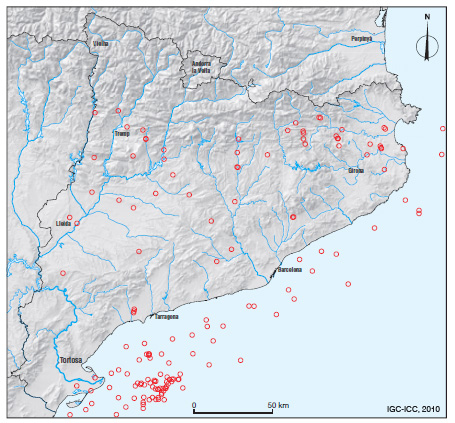
Figure 7: Location map of oil exploration wells, on land and on the offshore platform. The data provided by the surveys are essential for the construction of geological cross sections.
On the other hand, in structurally complex areas affected by several fold systems, like those often observed in Hercynian materials, the vertical reach of the cross-sections is usually much less, due to the difficulty of extrapolating data to depth. In the case of recent materials, such as fluvial deposits, the representation depth rarely exceeds a few dozen metres (figure 5).
As the knowledge of the constitution and the behaviour of the earth’s crust and the lithosphere advances (figure 8), the construction of cross-sections with depths greater than 100 km have become routine, on a crustal or lithosphere scale due to the growing availability of deep subsurface data, such as seismic reflection, magnetotelluric, gravimetry and seismic tomography.
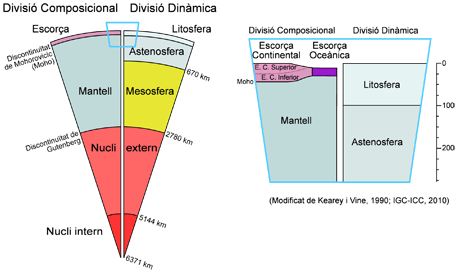
Figure 8: The internal structure and constitution of the Earth is known through the interpretation of geophysical data. The classical division makes reference to the composition of diverse layers: the dynamic division refers to their mechanical behaviour. Above, detail of the structure of the outermost part of the Earth (Modified from Kearey and Vine, 1990).
The balanced cross-sections and the restored cross-sections
EThe most usual method for evaluating and validating a geological cross-section of an area with determined structural styles (fold structures, extensional faults or thrusts) is to check what is called its “retro-deformability”. In other words, it should be possible to undo the deformation in order to be able to interpret how the different geological units were arranged before being deformed. A retro-deformable cross-section is called balanced cross-section if the cross-section or cross-sections that progressively undo the deformation are partially or totally restored cross-sections (figure 9).
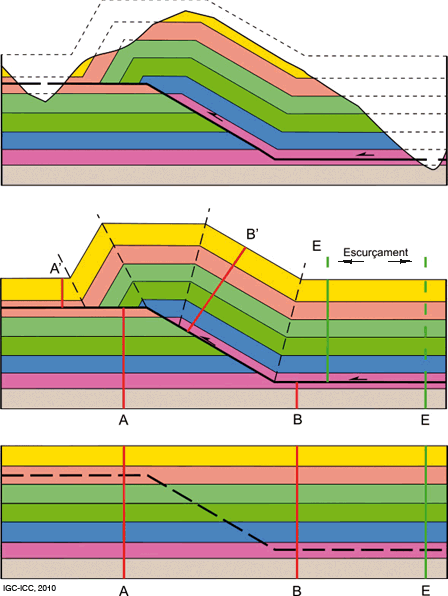
Figure 9: Geological cross-section, balanced cross-section and geological restored cross-section to the non-deformed state. These show the situation and the relationship between the rocky volumes at different moments of their geological history, before and after having been deformed and eroded.
The restored cross-section maintains the cohesion of the rocks before and after the deformation without superimpositions or gaps between the two stages. The interpretation of the structures in a balanced cross-section should always be coherent with the structures observed in the region, that is to say, with the structural style. The step between the restored cross-section and the deformed one, as has been interpreted at the present time, should be cinematically and mechanically consistent. The main objective of the construction of balanced cross-sections is to avoid the introduction of geometric errors during the construction of the geological cross-sections. This technique also permits the calculation of the values of the shortening and the stretching associated to the formation of tectonic structures, and making palinspastic reconstructions, i.e., those in which the geological materials are situated in the positions that they occupied at determined moments in geological history.
In the last few years, the advances in computer science allow us to develop construction methods of geological models directly in three dimensions. In the immediate future, the work and the visualization in tri-dimensional computing will be routine, and the maps and cross-sections will form part of one same reality seen from different perspectives.
